Empower Your Trading Journey with Data

Learn to analyze financial markets through innovative data-driven methods.

Courses designed for aspiring financial market traders.

Expert guidance on data analysis techniques for trading.

Transform your trading skills with our educational resources.

A bustling exhibition hall filled with people attending a financial conference or trade event. Prominent displays and booths from companies like Scope Markets, Daman Markets, and Hantec Markets are visible. Attendees are engaged in conversations, networking, and exploring the offerings and information provided by the exhibitors.
A laptop displays a financial trading platform with a candlestick chart showing stock market data. The chart is colorful, with blue and orange bars representing volume, and fluctuating lines indicating stock prices over time. Surrounding the laptop are two small potted plants on a white surface.
A person holds a smartphone displaying a stock market trading app with candlestick charts. A laptop is on a wooden table with a similar financial chart, indicating active trading or analysis. The setting suggests a home office or casual workspace.

Empowering Traders Through Data Insights

At Tradewithdata, we educate aspiring traders by analyzing market data, moving beyond traditional technical analysis methods. Our mission is to empower individuals to make informed trading decisions in financial markets.

A tablet displaying a detailed digital financial trading interface with various graphs, charts, and numerical data. The screen shows candlestick charts with green and red indicators, illustrating market trends and stock prices.
Our Mission
Our Vision

We strive to create a supportive learning environment where individuals can enhance their trading skills and knowledge, ultimately leading to successful trading experiences in the dynamic financial markets.

Our Services

Explore our unique educational offerings to master trading in financial markets using data-driven insights.

Trade Stocks using MTF With Data

Learn how to interpret the data generated by financial markets and use them effectively for informed trading decisions.
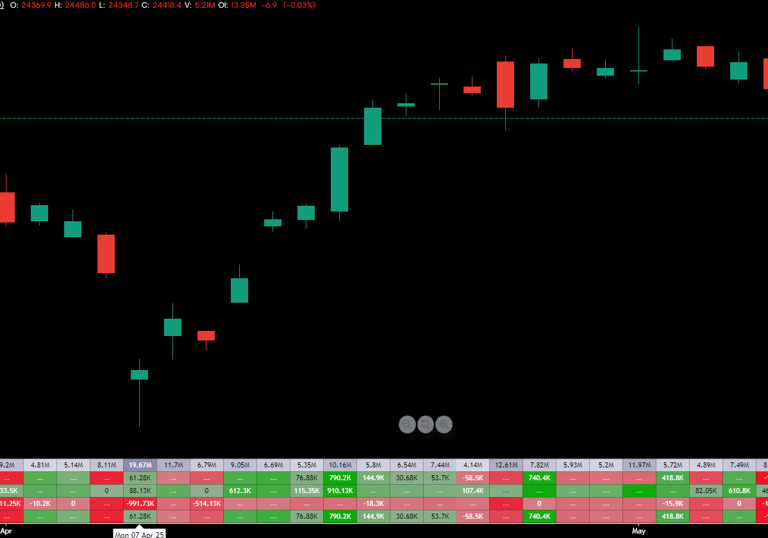
Learn how to use the data as provided by firm's "financial statements" along with data generated by the stock price movements to filter and select stocks for investment.

Invest (in stocks) With Data
Hands typing on a laptop keyboard with a screen displaying financial graphs and stock market data. Multiple charts and numbers are visible, indicating online trading or financial analysis.

About Us

A laptop and smartphone are placed on a wooden table. Both devices display financial charts and data, suggesting involvement in stock trading or market analysis. The setting appears to be indoors with natural light coming through a window.

What We Do: At "trade with data," we try to decipher the financial markets using market-generated data such as volume, volume-profile structure, price structure using O-H-L-C, candle size etc. The primary aspect of using the above-mentioned data points is to find "trend & liquidity" zones for the assets under consideration and use them to enter and exit the asset.

Who we are: Mr Indranil leads "trade with data". He has been a "swing trader" in Indian financial markets for the past 10 years, primarily trading assets such as Nifty(futures & options) and Bank-Nifty. Along with using traditional technical analysis (technical indicators), he uses data analysis on market-generated data points to improve the probability or to filter trades.

Along with being a swing trader, he is a stock investor. Wherein he uses the market-generated (stock price/volume fluctuations) data along with a few specific financial statement data points to select and invest in individual stocks.